Dashboard
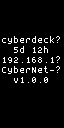
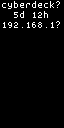
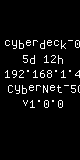
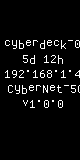
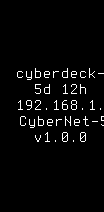
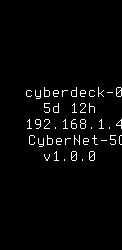
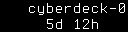
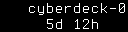
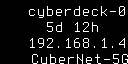
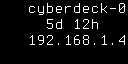
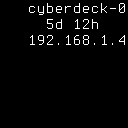
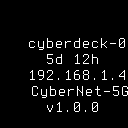
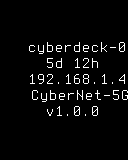
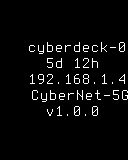
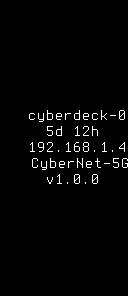
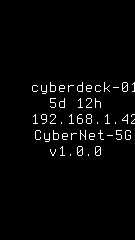
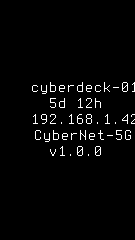
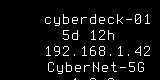
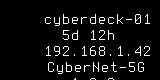
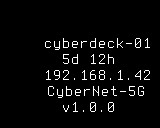
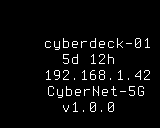
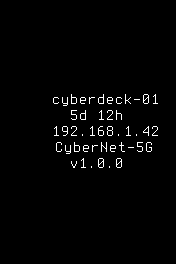
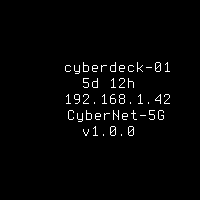
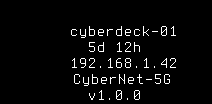
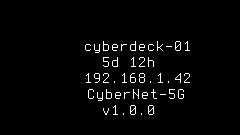
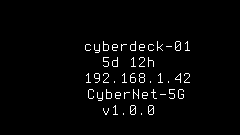
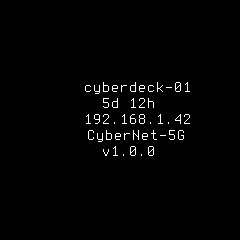
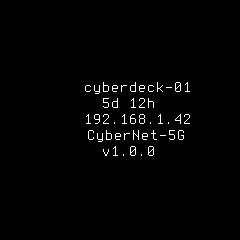
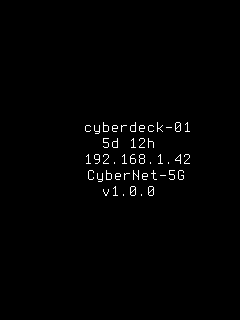
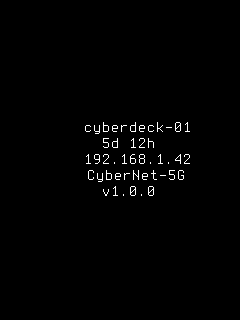
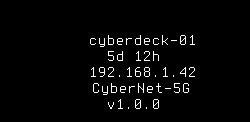
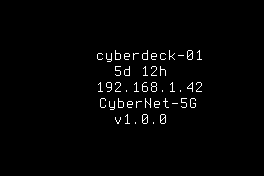
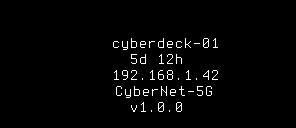
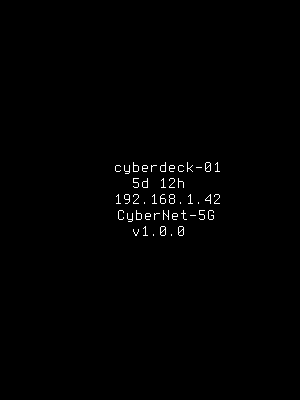
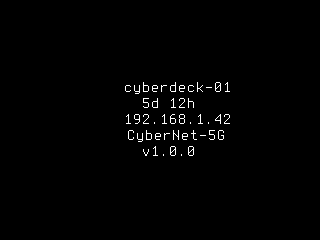
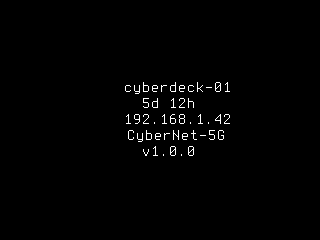
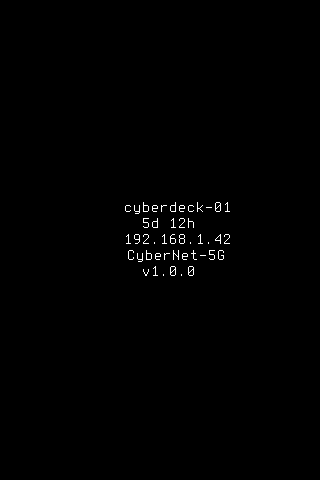
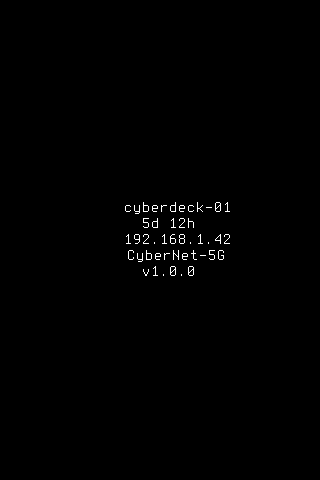
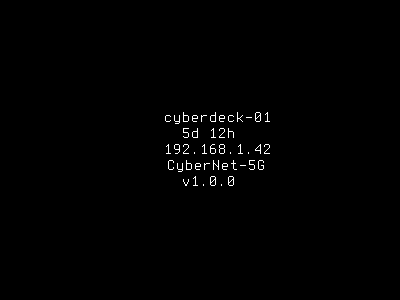
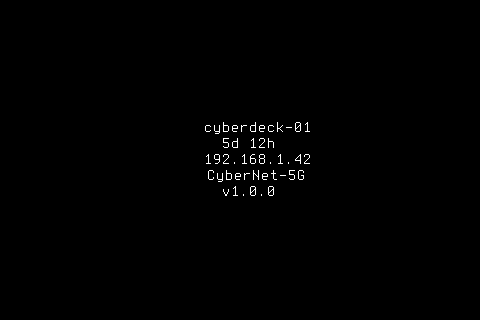
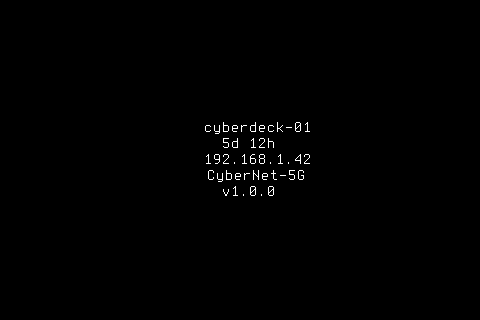
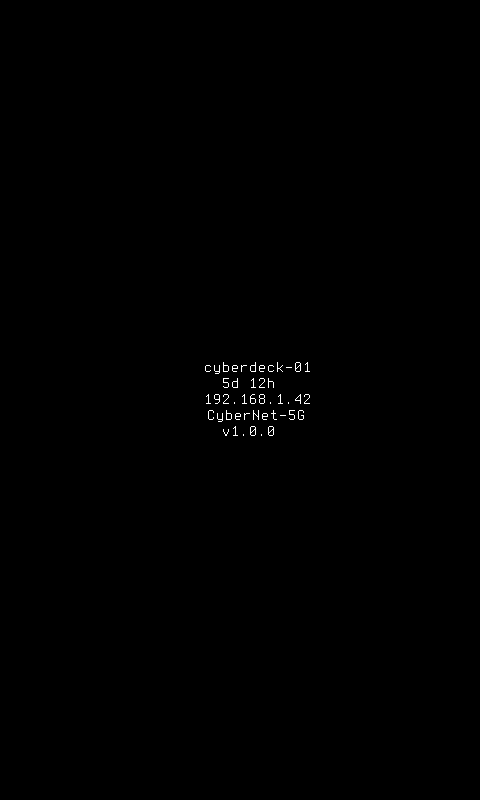
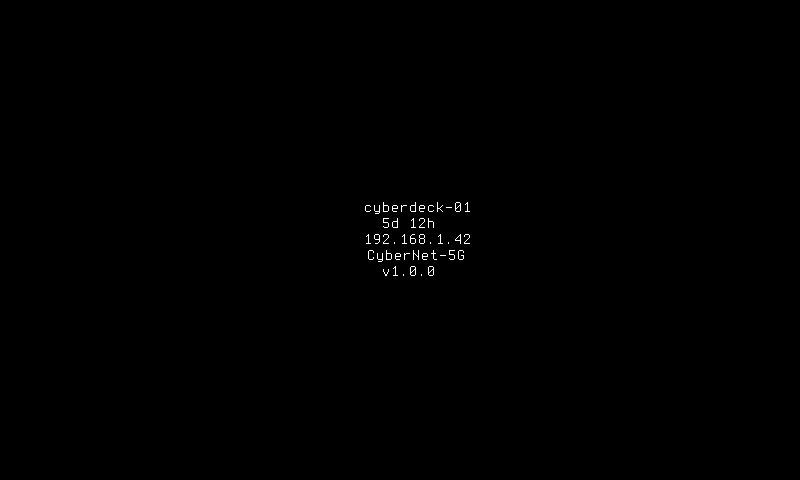
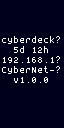
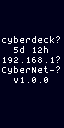
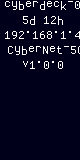
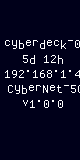
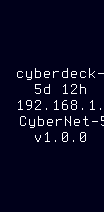
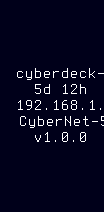
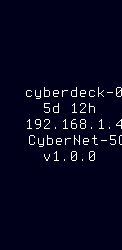
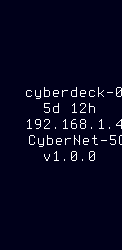
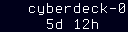
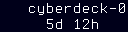
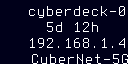
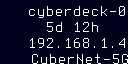
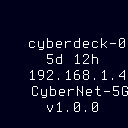
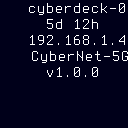
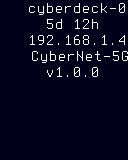
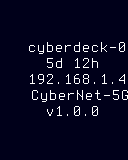
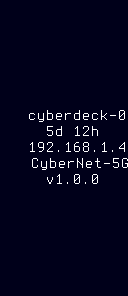
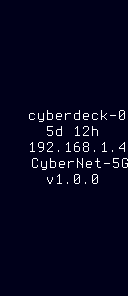
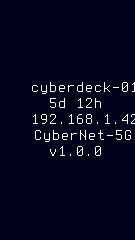
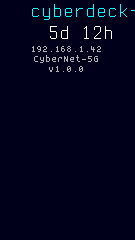
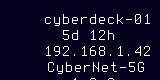
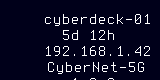
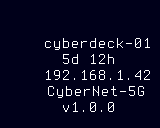
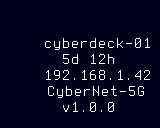
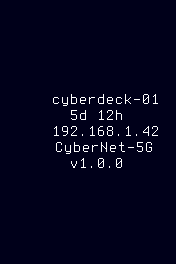
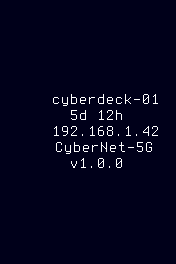
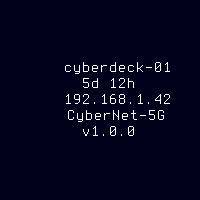
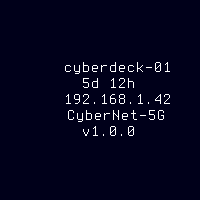
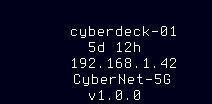
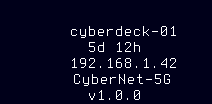
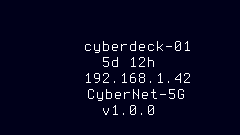
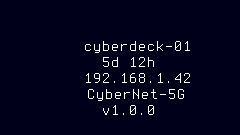
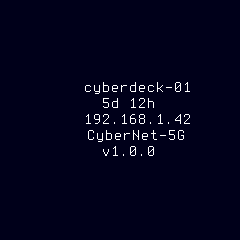
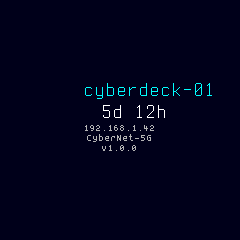
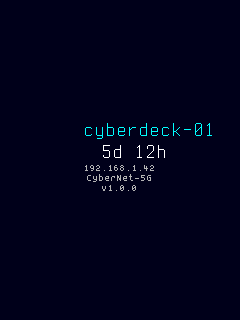
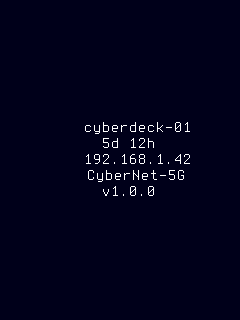
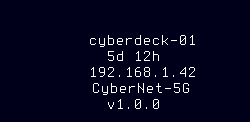
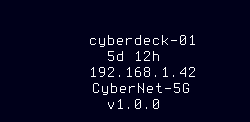
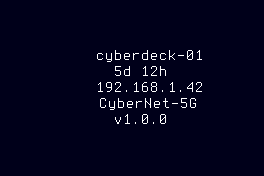
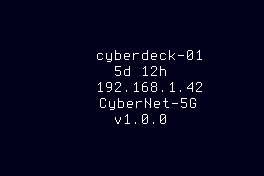
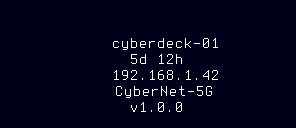
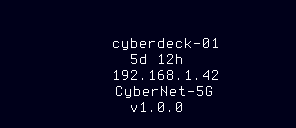
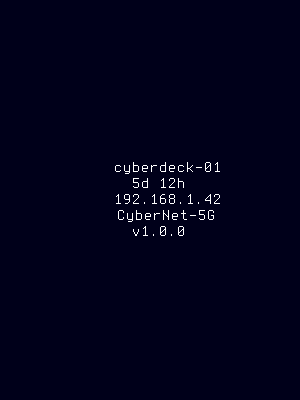
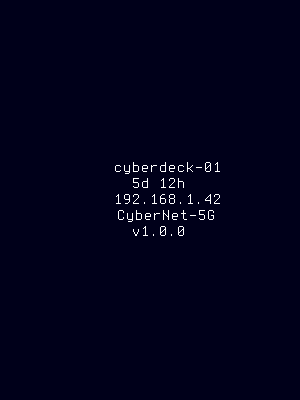
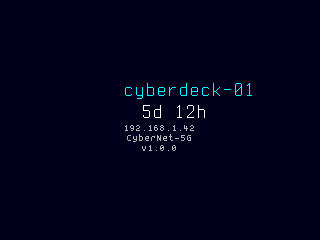
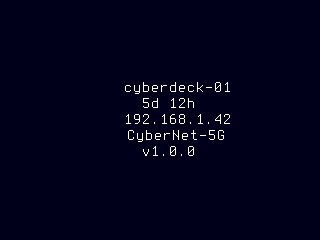
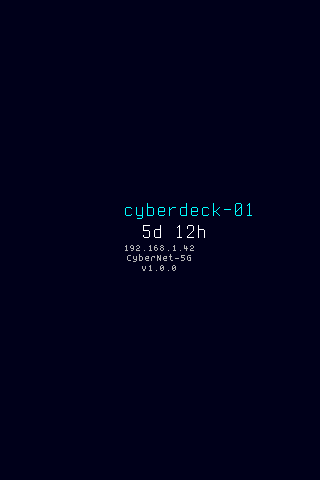
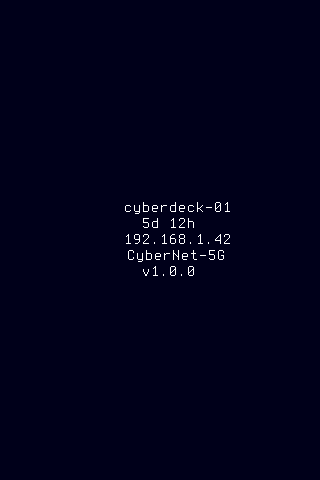
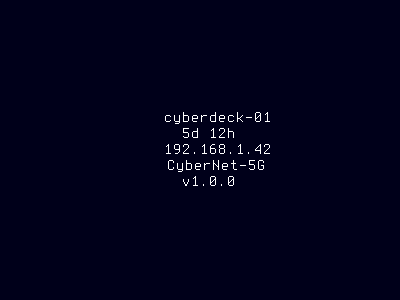
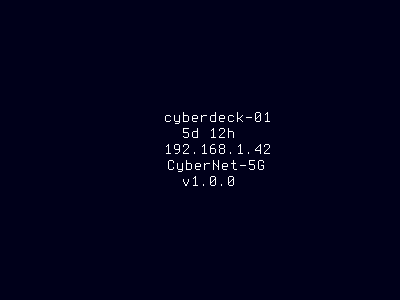
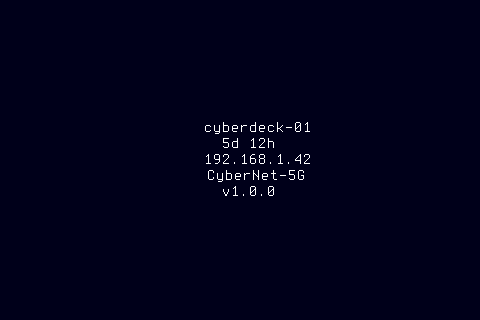
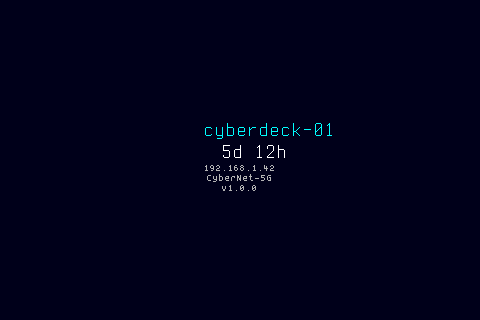
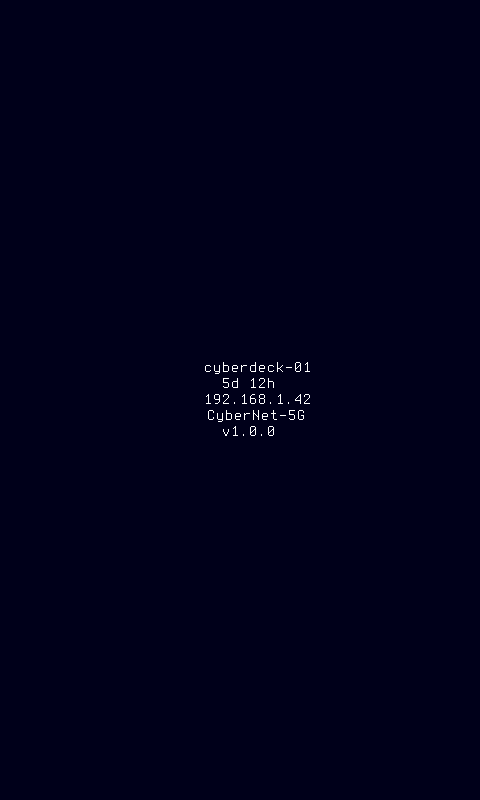
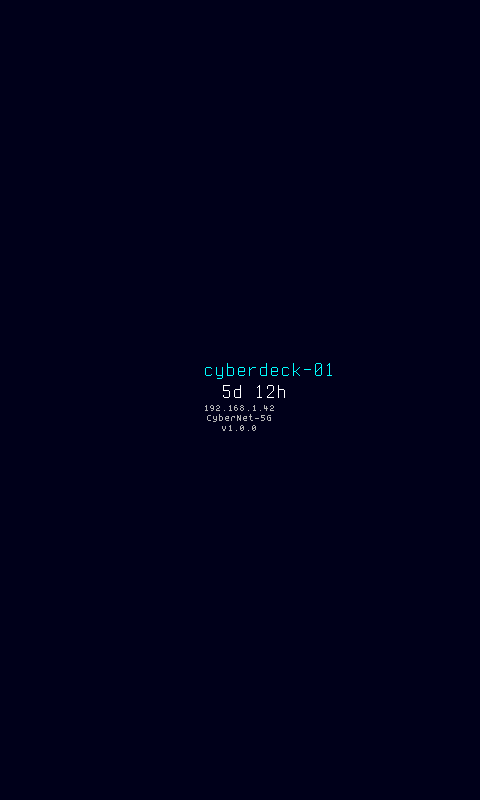
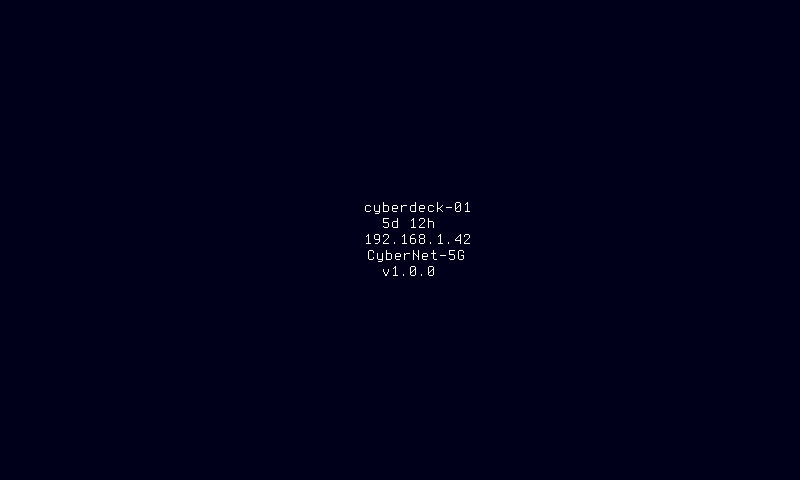
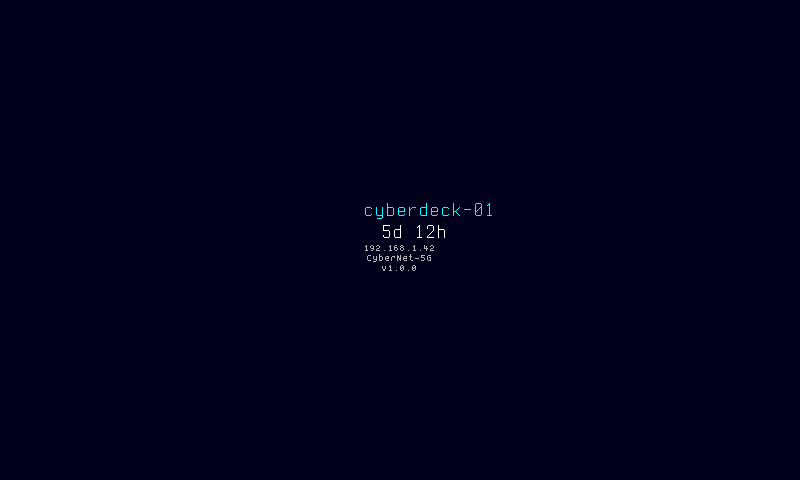
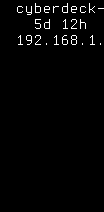
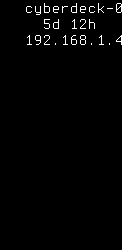
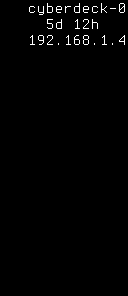
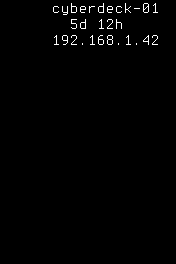
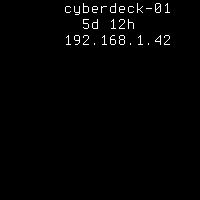
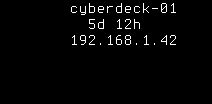
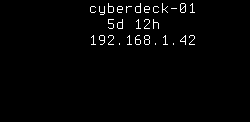
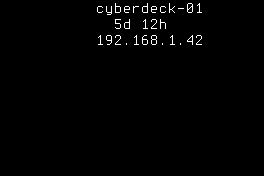
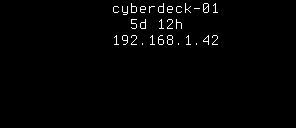
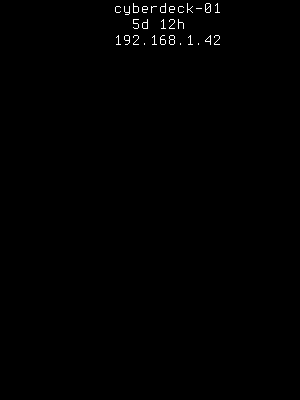
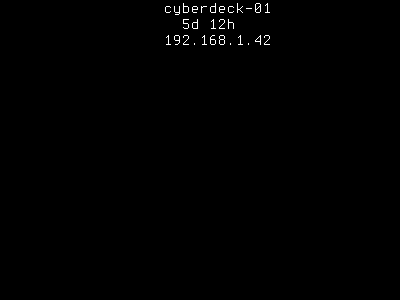
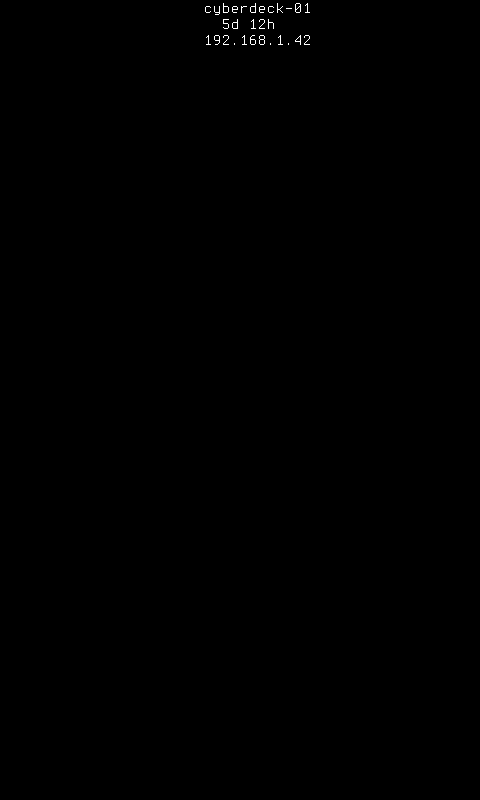
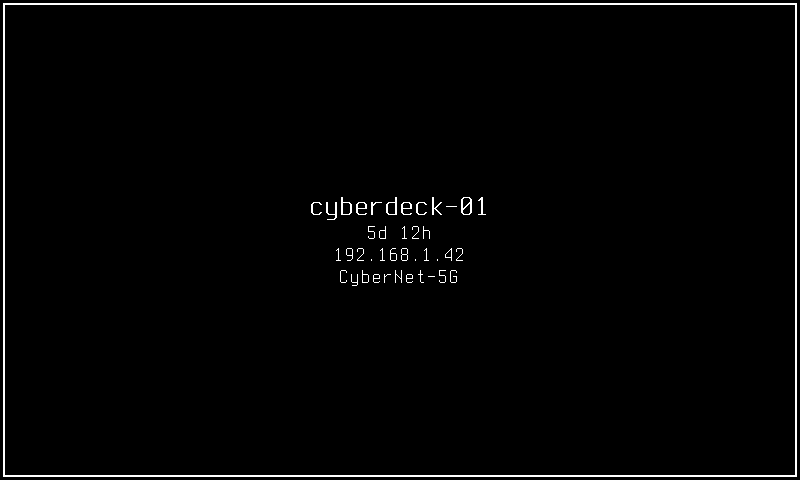
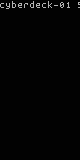
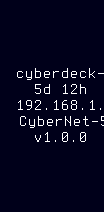
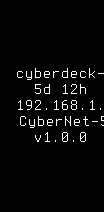
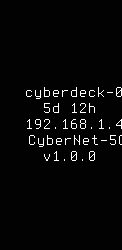
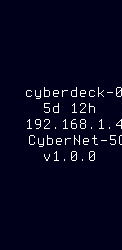
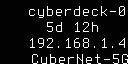
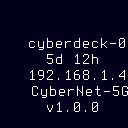
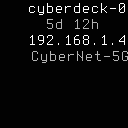
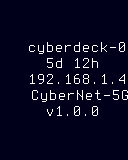
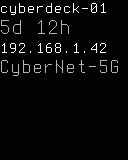
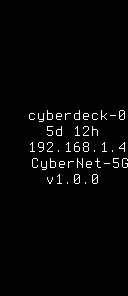
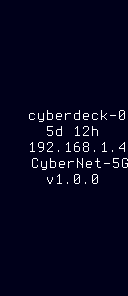
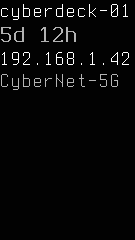
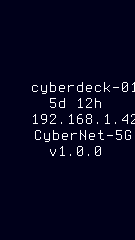
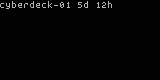
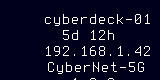
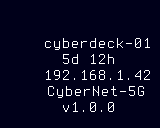
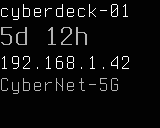
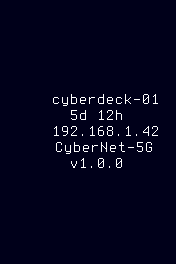
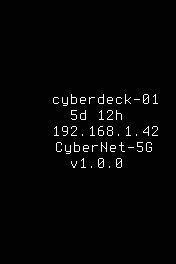
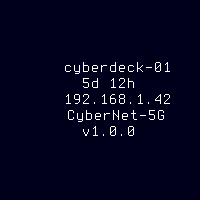
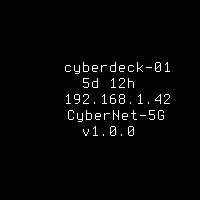
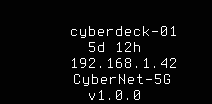
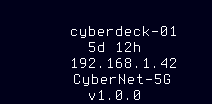
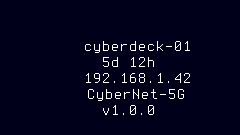
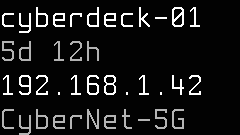
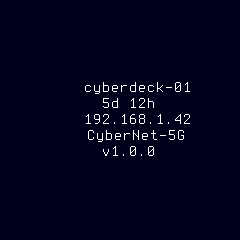
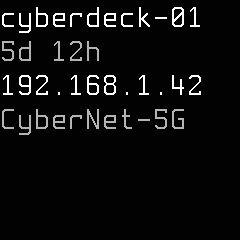
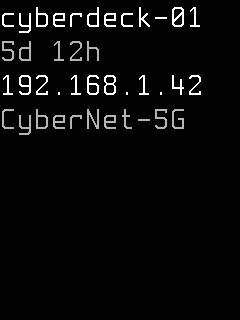
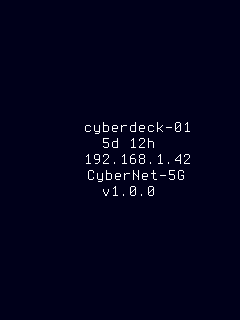
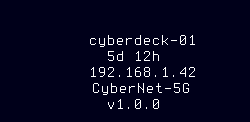
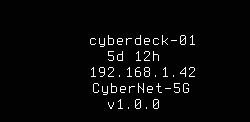
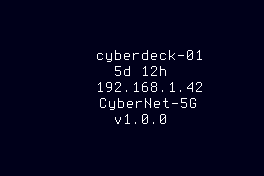
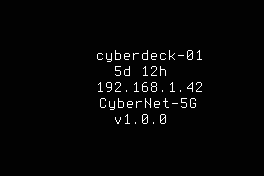
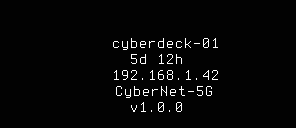
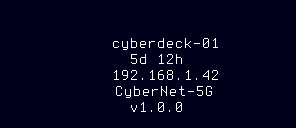
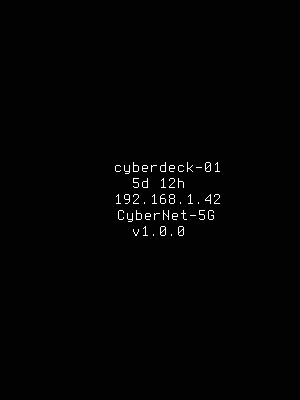
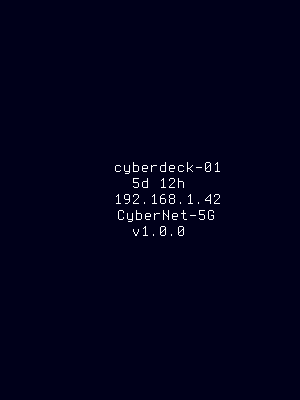
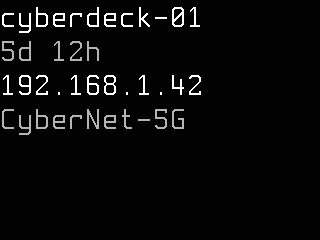
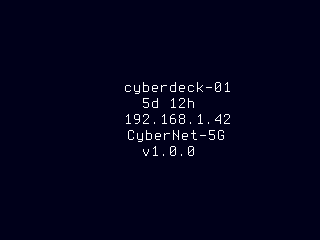
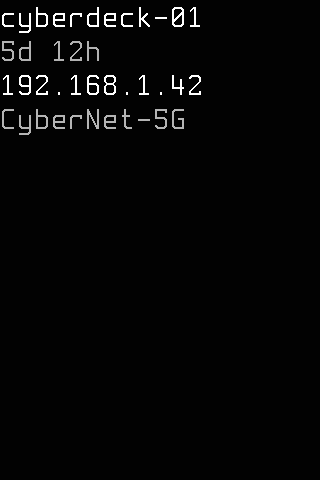
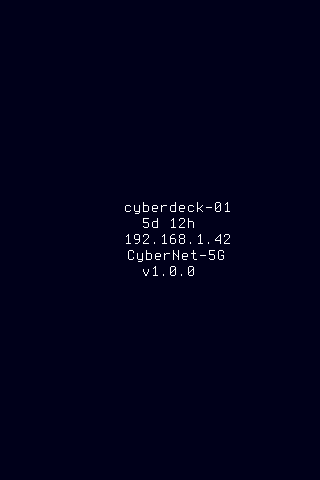
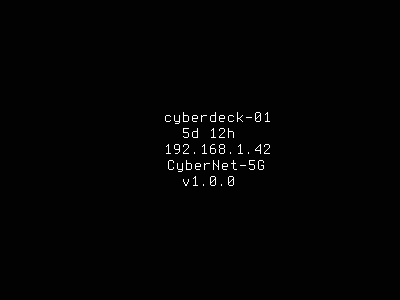
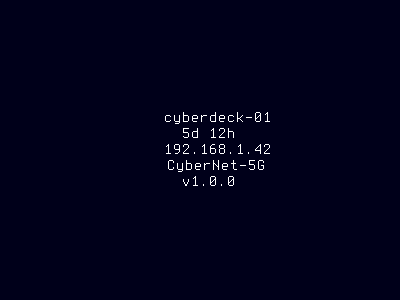
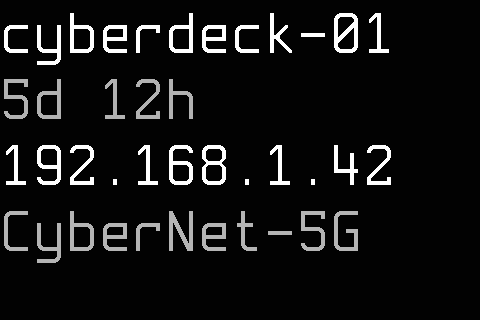
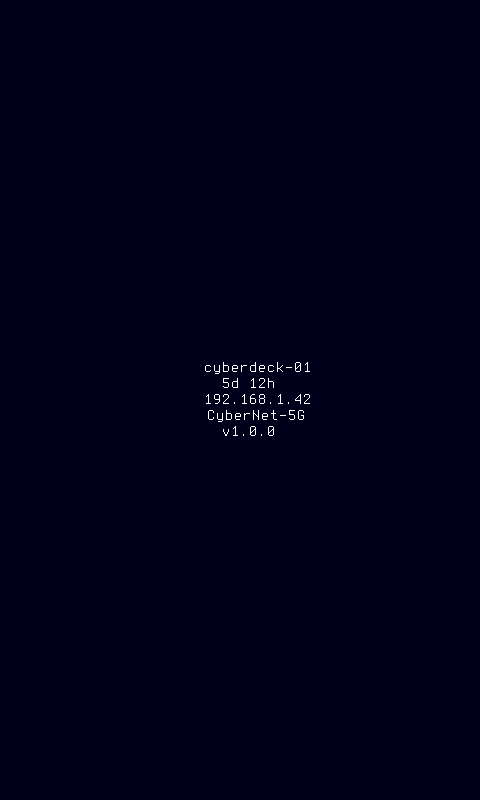
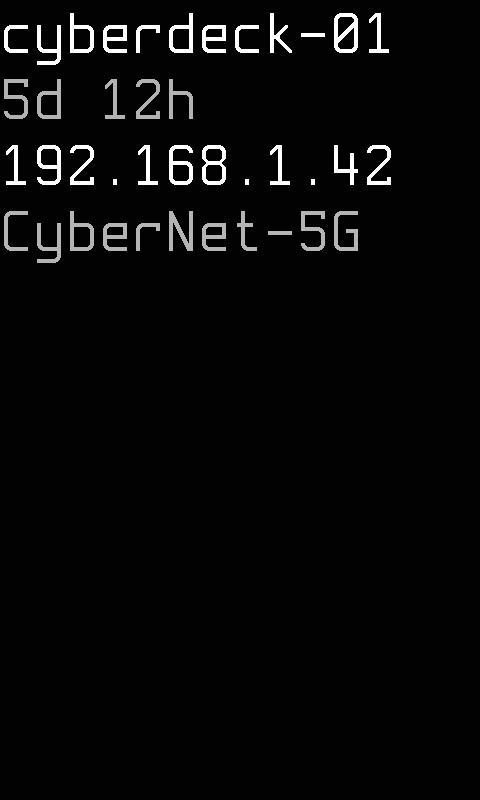
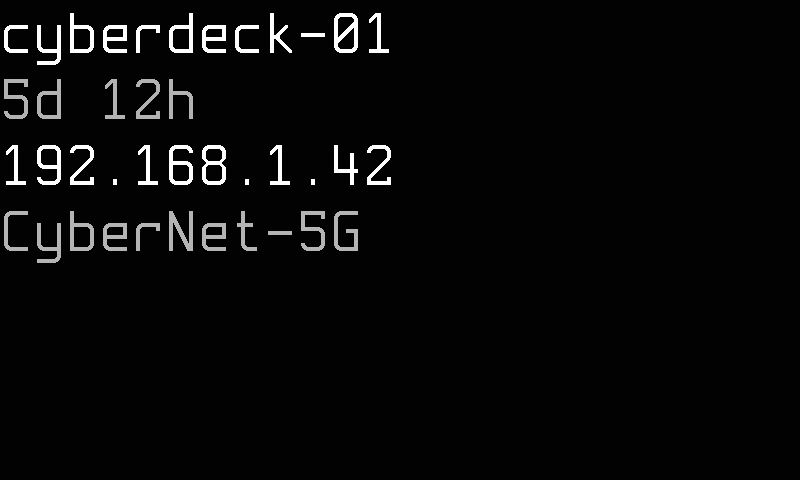
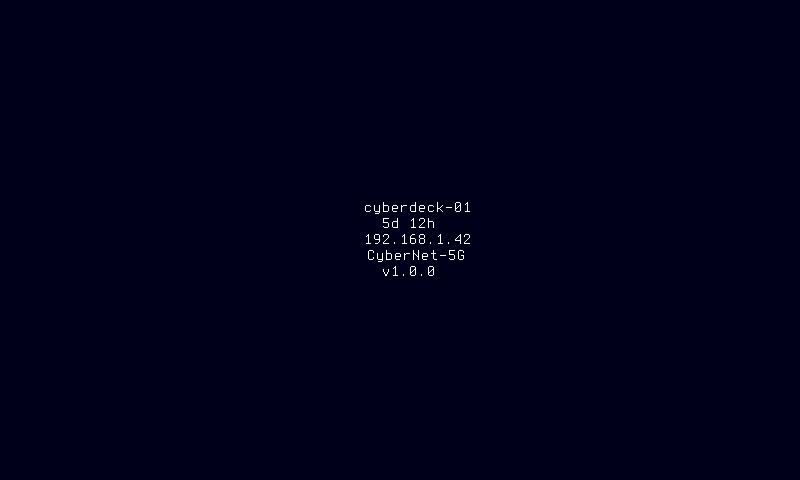
A consolidated status overview showing hostname, uptime, primary IP address, Wi-Fi SSID, and the CyberHUD build version at a glance. This is the default passive mode for panels without input controls.
Quick Start
How It Works
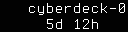
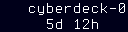
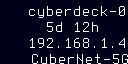
The dashboard mode queries live system state and renders a multi-row text summary showing hostname, uptime, primary IP address, Wi-Fi SSID, and the CyberHUD build version — all arranged as left-aligned text rows stacked vertically. The display redraws every 1 second (the default render-loop tick) and only flushes to the panel when the underlying data changes, as detected by a composite cache key of all displayed fields.
Data is sourced from OS APIs at each render cycle: the hostname from the kernel, uptime from /proc/uptime (Linux) or equivalent, the first non-loopback IPv4 address from the network interface list, and the connected Wi-Fi SSID from wireless subsystem queries. When a data source is unavailable the mode substitutes placeholder text — "(no network)" for IP, "(no wifi)" for SSID, and "dev" for version — ensuring the layout always has content to display.
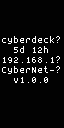
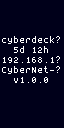
On panels with a pixel width below 128, the dashboard automatically selects a compact resolution-specific style that shows only hostname and IP, omitting rows that would be truncated. The style registry holds resolution-specific layouts for all six panel capability classes, and the best-fit style is chosen automatically based on pixel dimensions unless the user explicitly overrides it.
Info
The dashboard responds to button input when available — pressing the primary button navigates to the menu, and the secondary button forces a refresh.
Options
| Key | Type | Description | Default | Allowed Values |
|---|---|---|---|---|
color_accent |
string | Accent color for the uptime heartbeat indicator and highlight elements on color panels | cyan | cyan, green, amber, red, white, none |
style |
string | Resolution-specific visual presentation style controlling layout density and information shown | Resolution-specific style names (e.g., color-240x240, mono-128x32, eink-250x122) |
Configure options via the CLI:
Style Variants
The dashboard uses a resolution-specific style registry — the best layout is chosen automatically based on your panel's pixel dimensions. In general, styles fall into two density categories:
- full-resolution styles — display hostname, uptime, IP address, Wi-Fi SSID, and version as separate text rows. Best for panels with enough vertical space to show all rows.
- compact styles — condense output to just hostname and IP, omitting rows that would be truncated. Automatically selected for narrow panels (< 128px wide) unless the user explicitly sets a style.
CLI Examples
Activate the dashboard on the main region:
Query the current dashboard settings:
Switch to compact layout for small panels:
Set a green accent color:
Combine style and accent in one command:
Panel Compatibility
The dashboard is the default mode for panels without input controls. It works on all panel resolutions — no input pins are required. On narrow panels (pixel width below 128), the compact style is automatically selected to ensure content fits without truncation. Color information is discarded on monochrome panels, rendering all dashboard widgets in the native foreground color.
| Capability | Description | Behavior |
|---|---|---|
| MonoFast | Fast-refresh monochrome OLED (128×32, 128×64, 128×128) | Fully supported — compact text layout with periodic refresh, white-on-black rendering |
| MonoSlow | Slow-refresh monochrome e-ink (122×250, 176×264, 200×200, 296×128, 400×300, 480×800, 800×480) | Fully supported — static dashboard frame, updates only on data change to minimize redraws |
| GrayscaleFast | Fast-refresh grayscale (160×80, 240×135, 240×240, 320×240, 480×320, 800×480) | Fully supported — grayscale widget rendering with periodic refresh |
| GrayscaleSlow | Slow-refresh grayscale e-ink (122×250, 176×264, 200×200, 400×300, 800×480) | Fully supported — static grayscale layout, updates on data change |
| ColorFast | Fast-refresh color TFT (128×128, 160×80, 240×135, 240×240, 320×240, 480×320, 800×480) | Fully supported — full color widgets with status-mapped colors and periodic refresh |
| ColorSlow | Slow-refresh color e-ink (122×250, 176×264, 200×200, 400×300, 800×480) | Fully supported — static color layout, updates on data change |
Tip
Even though the dashboard is non-interactive by default, panels with buttons can still use it. The primary button navigates to the menu and the secondary button triggers a data refresh.
Related Pages
- Display Modes — overview of all available modes
- Getting Started: CLI Usage — introduction to
cyberhudctlcommands - Configuration — persistent configuration options
- STEMMA — dedicated I2C device scanning mode
- GPIO — detailed read-only GPIO pin state view
- System — full system information display
- WiFi — wireless network status (dashboard shows SSID summary)
- Menu — interactive mode selection (primary button navigates here)
- Cycle — automatic mode rotation including dashboard
Snapshots
Color


E-Ink
Grayscale


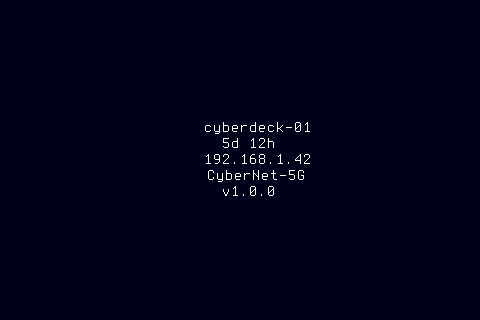
Mono